Agents, LLMs, vector stores, custom logic—visibility can’t stop at the model call.
Get the context you need to debug failures, optimize performance, and keep AI features reliable.
Agents, LLMs, vector stores, custom logic—visibility can’t stop at the model call.
Get the context you need to debug failures, optimize performance, and keep AI features reliable.
Tolerated by 4 million developers
LLM endpoints can silently fail with downtimes, transient API errors, or rate limits. Imagine your AI-powered search, chat, or summarization just stopping without explanation.
Sentry monitors for these failures and alerts you instantly in real-time, and gets you to the line of code, the suspect commit, and the developer who owns it, so you can fix them before your users are impacted.
You're already juggling complex prompts, unpredictable model output, and edge cases you didn’t even know existed. Now something’s breaking, and you’re stuck guessing.
Seer, Sentry’s AI-powered debugging agent, analyzes your error data to surface root causes fast (with 94.5% accuracy), so you can spend less time digging and more time fixing. It’s our AI... fixing your AI.
When something breaks in your AI agent, whether a tool fails silently, a model times out, or it returns malformed outputs, traditional logs don’t show the full picture.
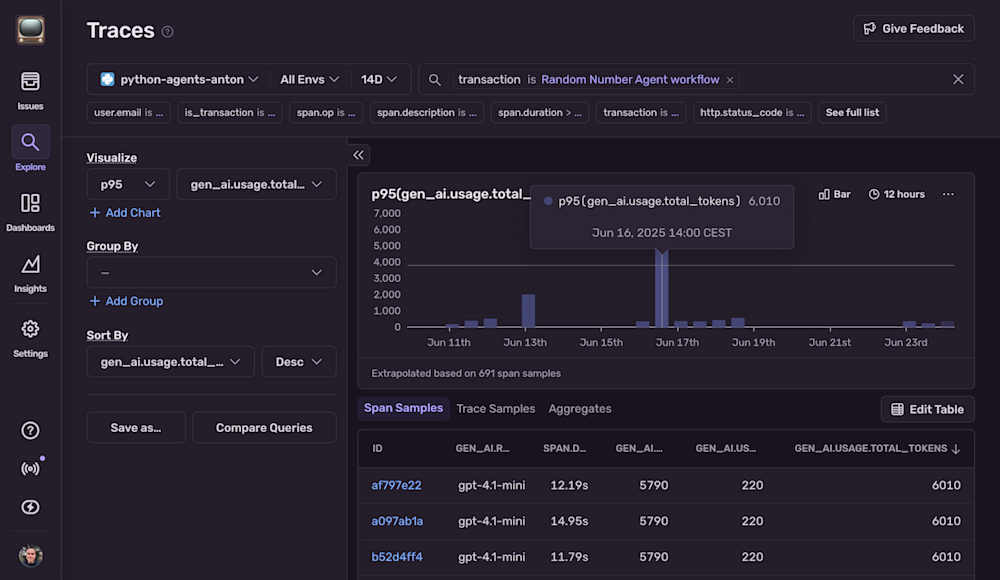
Sentry gives you complete visibility into the agent run: prompts, model calls, tool spans, and raw outputs, all linked to the user action that triggered them. You can see what failed, why it happened, and how it affected downstream behavior, making it easier to debug issues and design smarter fallbacks.
LLMs can introduce unpredictable delays: one prompt returns in seconds, another takes much longer due to provider load or network issues.
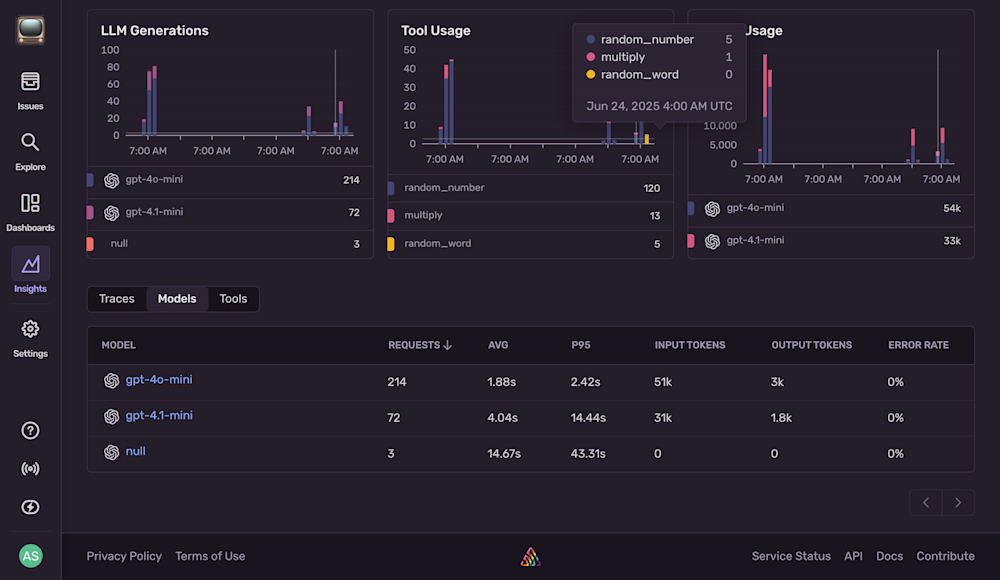
Sentry shows you how your LLM calls are performing over time, with breakdowns by provider, endpoint, and prompt. It’s easy to spot slowdowns, debug performance issues, and keep your AI features fast and reliable for users.
A single large input or unexpected spike can drive up token usage fast.
Sentry continuously tracks token consumption and LLM-related costs, so you can catch unusual patterns early and keep LLM costs under control. If usage patterns shift unexpectedly or costs begin to escalate, Sentry sends immediate alerts so you can investigate, pause, or throttle high-cost activity before it becomes a problem.
Sentry provides granular analytics on token usage and costs at the provider, endpoint, and even individual request level.
You can easily spot which queries, workflows, or features are consuming the most tokens, then dig into the details to optimize prompt design and trim waste.
We support every technology (except the ones we don't).
Get started with just a few lines of code.
Install sentry-sdk from PyPI:
pip install "sentry-sdk"
Add OpenAIAgentsIntegration() to your integrations list:
import sentry_sdk
from sentry_sdk.integrations.openai_agents import OpenAIAgentsIntegration

sentry_sdk.init(
    # Configure your DSN
    dsn="https://[email protected]/0",
    # Add data like inputs and responses to/from LLMs and tools;
    # see https://docs.sentry.io/platforms/python/data-management/data-collected/ for more info
    send_default_pii=True,
    integrations=[
        OpenAIAgentsIntegration(),
    ],
)
That's it. Check out our documentation to ensure you have the latest instructions.
increase in developer productivity
engineers rely on Sentry to ship code
faster incident resolution
Get started with the only application monitoring platform that empowers developers to fix application problems without compromising on velocity.


